
This trick made visual communication easier for me
1. Sketch something
Just use one color (for now). There should be a nice contrast between background and foreground.
2. Take a photo
Make sure the lighting is okay. (! Helps with the next steps !)
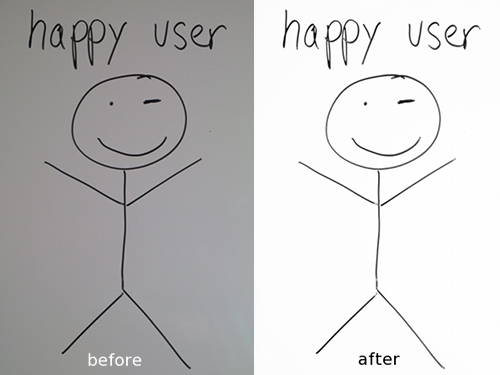
3. Adapt the photo settings
Crop your photo to the relevant area and change the following properties with the image manipulation tool of your choice:
- Brightness
increase the brightness a little bit such that the background in your image gets more white - Contrast
increase the contrast to a maximum - Saturation
desaturate it — turn saturation down. (! reduces unnecessary color in your sketch and will improve the path detection !)
( I’m blessed because my phone supports manipulating those properties natively, most smartphones do — fingers crossed )
Here’s a before/after so you can see how the end result could look like:
4. Let Inkscape do some magic
This step involves some algorithmic tech magic — you will need Inkscape [0], a free, open source vector graphic manipulation tool, for it. You can find a download link on the bottom of this article.
Open your optimized image with Inkscape
Select the image and click on “Path/Trace Bitmap…”
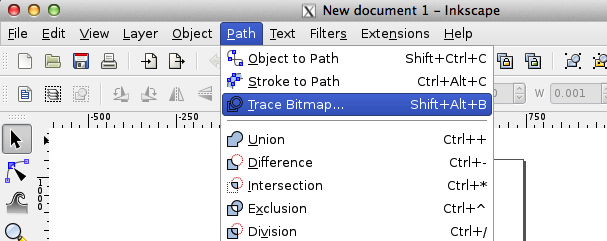
Then make sure “brightness cutoff” is selected and play around with the threshold. If you click the update button you can see which paths Inkscape detected.
When you think it’s right, click okay and remove the image from the workspace — hello there vector representation of your image.
5. Export as vector graphic
Now that you have your whiteboard image vectorized you can play around with it as a vector path. That means you can move, delete, add path points, apply other vectorization magic (e.g. path simplification, smoothing, etc.), extract and manipulate subpaths, and colorize it however you want. Then save it as vector graphic (e.g. .svg).
Why is that awesome?
With your image as a vector path you can do a lot of neat stuff:
- Create reusable vector components from it
Import your vector graphic components into other vector graphics.
( very useful for web designers if you don’t want to sketch that button for the nth time ) - Print it in high resolution
It’s a vector graphic, it will look good in any resolution ;-) - Animate your creation (!!)
There are a few neat libraries that let you import and animate vector graphics easily — vector path transformation nowadays works like a charm.
This takes your sketched graphic to the next level and helps you to communicate relations to time more effectively
What tools do you use to communicate concepts and ideas visually? Are there any trade-offs? I’d love to hear in the comments!
BTW I’d also love to hear about how the process worked out for folks using a blackboard. I know some guys at Google use and love them — oh how I wish I had one too…
References
[0] Inkscape Vector Image Manipulation Tool
http://www.inkscape.org/